Data fluency is now a C-suite survival skill. Organizations whose executives make decisions from real time, evidence based dashboards consistently outpace competitors who still rely on gut instinct and quarterly spreadsheets. Combined with robust Enterprise Data Management solutions, the right Business Intelligence tools convert raw, siloed data into the strategic clarity that drives revenue growth, operational efficiency, and risk mitigation, but only when the platform matches the enterprise’s data environment, team maturity, and governance requirements.
This guide reduces the noise. You’ll find a clear definition of BI, a concise market context, an objective look at the top 10 platforms for 2026, a decision framework for enterprise selection, and answers to the questions your team will raise before signing a contract.
Talk to a Data Management Expert
What Are Business Intelligence Tools?

Business Intelligence tools are software platforms that collect, transform, and present data in formats that support analysis and strategic decision making. They turn fragmented raw data from databases, cloud applications, spreadsheets, and streaming sources into actionable insights delivered through dashboards, reports, and alerts.
Four core functions make these platforms valuable at enterprise scale:
1) Data Integration
Native connectors aggregate data from dozens or hundreds of sources into a unified view, eliminating manual data pulls.
2) Data Transformation
ETL and ELT pipelines clean, standardize, and model raw data so analysts are working with a consistent, trustworthy dataset.
3) Data Visualization
Charts, heat maps, and interactive dashboards surface patterns that tables of numbers obscure.
4) Reporting and Distribution
Scheduled reports and embedded dashboards push the right insight to the right stakeholder at the right time.
For a deeper look at how BI platforms compare to standalone charting tools, see Business Intelligence vs Data Visualization: What Works Best.
Useful link: What is Data Storage? A C-Suite Guide to Future Ready Infrastructure
BI Market Context: Why 2026 is a Pivotal Year
The numbers validate the urgency. According to Statista, the global business intelligence software market is projected to generate approximately USD 31.03 billion in 2026 and grow to USD 36.46 billion by 2029. Based on the same growth rate, the United States is estimated to account for approximately USD 15.54 billion of the global market in 2026.
Beyond market size, the adoption signals are equally telling:
- A Deloitte survey found companies led by data focused CEOs are 77% more likely to outperform peers.
- 49% of companies increased their use of BI analytics since the pandemic, per a Sisense survey.
- 93% of senior executives consider social media data a critical future resource for business intelligence.
- BI platforms rank as the third most preferred enterprise technology, behind only cloud infrastructure and digital trust frameworks (Infosys).
The takeaway for C-suite leaders: BI adoption is not about a differentiator; it is table stakes.
How Modern Business Intelligence Tools Work?
Enterprise BI platforms operate as an analytical layer on top of your data infrastructure. Data is consolidated from multiple source systems into a centralized data warehouse or lakehouse, Snowflake, BigQuery, Redshift, or a Fabric based environment, where it is modeled and governed before being surfaced in dashboards. Enterprise data management consulting helps organizations establish the governance, data quality, and integration framework required to support these modern BI environments.
What separates 2026 generation platforms from their predecessors is the depth of embedded intelligence:
- Machine learning models detect anomalies, forecast trends, and surface next best action recommendations without requiring a data science team to build custom scripts.
- Natural language query (NLQ) interfaces allow executives to ask questions in plain English and receive chart ready answers in seconds.
- Mobile first dashboards put board ready KPIs in a CFO’s pocket during a flight.
- Data governance layers enforce row level security, audit trails, and access controls that satisfy SOC 2, HIPAA, and GDPR requirements.
This architecture makes BI the connective tissue between raw data infrastructure and executive strategy, a point developed further in our overview of SaaS Business Intelligence: Transforming Decision Making.
Business Intelligence for C-Suite Executives: Why It Matters
The ROI of BI investment accrues differently across the leadership team, but it accrues everywhere:
- CEOs monitor enterprise KPIs in real time and align operational performance to long term strategy without waiting for monthly reporting cycles.
- CFOs run financial scenario planning, cost optimization models, and cash flow forecasting against live data rather than T+5 extracts.
- CIOs/CTOs gain infrastructure visibility and track digital transformation milestones across programs and vendors.
- CMOs unify campaign performance, customer lifetime value, and channel ROI in a single view, replacing three separate analytics portals with one source of truth.
Combining cloud based BI platforms with AI adoption strategies accelerates every one of these use cases by automating the insight generation layer so leaders spend time acting on intelligence rather than waiting for it.
Key Features to Look for in a Business Intelligence Tool
Before evaluating vendors, align your evaluation team on the dimensions that matter for your environment. Use these six criteria as a scorecard:
| Criterion | What to Assess? |
| Data connectivity | Number of native connectors; support for your warehouse, SaaS stack, and streaming sources |
| AI and augmented analytics | NLQ, automated anomaly detection, predictive forecasting, not just rendering charts |
| Governance and security | Row level security, role based access, audit logs, SOC 2 / HIPAA / GDPR certifications |
| Scalability and performance | In memory engines, query caching, elastic cloud architecture under concurrent load |
| Self service usability | Drag and drop authoring and business user dashboards that reduce the IT reporting backlog |
| Total cost of ownership | Licensing model, infrastructure costs, training, and administration not the listed price |
Connect with Our Data Specialists
Top 10 Business Intelligence Tools in 2026

1) Microsoft Power BI
Best for: Microsoft centric enterprises
Power BI’s deep integration with Excel, Azure Synapse, and the Microsoft 365 ecosystem makes it the default choice for organizations already running Microsoft infrastructure. Real time dataset refresh, AI powered natural language Q&A, and a broad library of custom visuals give both analysts and executives what they need from a single license. Copilot integration, introduced in 2024, now lets users generate DAX formulas and report summaries through conversational prompts.
Typical use cases: Sales pipeline tracking, financial close reporting, operational KPI dashboards.
2) Looker Studio
Best for: Marketing and e-commerce teams in the Google ecosystem
Formerly Google Data Studio, Looker Studio pairs a generous free tier with powerful integration into BigQuery, Google Analytics 4, and Google Ads. Real time collaboration mirrors the Google Docs experience, lowering adoption friction for non technical users. The paid Looker platform adds governed semantic modeling for enterprises requiring consistent metric definitions across teams.
Typical use cases: Digital marketing analytics, customer journey analysis, product usage reporting.
3) Domo
Best for: Organizations prioritizing data integration breadth
Domo’s library of 1,000+ pre built connectors is the platform’s defining feature; it can pull from virtually any data source without custom engineering. Real time data streaming, built in AI tools, and an app development environment make it equally viable for frontline operational dashboards and executive summary views. Its cloud native architecture scales from mid market to Fortune 500 without infrastructure investment.
Typical use cases: Supply chain monitoring, retail KPI tracking, financial forecasting.
4) Qlik Sense
Best for: Complex, non linear data exploration
Qlik’s associative analytics engine is its clearest differentiator. Unlike query based tools that only show what you explicitly ask for, Qlik indexes relationships across the entire dataset and highlights what’s excluded, surfacing insights that structured queries would never return. Multi cloud deployment and strong governance controls make it enterprise ready without sacrificing analytical flexibility.
Typical use cases: Healthcare quality analytics, manufacturing operational data, customer satisfaction analysis.
5) Tableau
Best for: Data visualization and storytelling
Tableau has been the visualization benchmark for over a decade, and its 2026 incarnation, now deeply integrated with Salesforce Data Cloud, extends that lead. Its drag and drop canvas lets analysts build publication quality dashboards without writing code. Tableau Pulse, launched in 2024, delivers AI generated metric digests directly to business users via email and Slack, reducing dashboard browsing time.
Typical use cases: Executive data storytelling, public health tracking, financial analysis.
Useful link: Why Data Governance in Healthcare is Critical for Patient Safety and Compliance?
6) Sisense
Best for: Embedded analytics and developer driven customization
Sisense’s in chip processing architecture compresses query times on massive datasets, making it a strong choice for product teams embedding analytics inside customer facing applications. Its white labeling capabilities and REST APIs let development teams ship branded analytics experiences without building a BI layer from scratch. The platform’s AI driven insights engine surfaces anomalies and recommendations proactively.
Typical use cases: SaaS product analytics, IoT operational monitoring, e-commerce performance.
7) Zoho Analytics
Best for: SMBs seeking enterprise features at SMB pricing
Zoho Analytics delivers data blending, automated syncing, and 500+ connectors at a price point that mid market companies can absorb without a multi year licensing negotiation. Its Zia AI assistant answers natural language questions, generates automated narratives, and flags anomalies, capabilities typically reserved for platforms costing five times as much.
Typical use cases: Sales analytics, marketing attribution, customer support optimization.
8) SAP BusinessObjects
Best for: Large enterprises running SAP ERP environments
For organizations where SAP is the system of record, BusinessObjects eliminates the integration overhead that other BI tools require. It delivers enterprise grade reporting, crystal clear paginated documents, and a governance framework mature enough for global compliance mandates. Its tight ERP coupling means financial and supply chain data is available for analysis without complex ETL pipelines.
Typical use cases: Financial reporting, supply chain management, enterprise performance monitoring.
9) TIBCO Spotfire
Best for: Advanced and predictive analytics in data intensive industries
Spotfire combines visual analytics with data science grade capabilities, predictive modeling, R and Python extensibility, and real time streaming analytics in a unified interface. Its geo analytics and time series capabilities are particularly strong in sectors where operational data arrives continuously, and decisions must follow in near real time.
Typical use cases: Predictive maintenance in energy, clinical trial analytics in life sciences, network performance in telecom.
10) Dundas BI
Best for: Organizations requiring deeply customized BI experiences
Dundas BI trades breadth for depth. Its drag and drop canvas and custom scripting engine let development teams build reporting portals that look and behave exactly as the business requires, not as the vendor’s template dictates. That flexibility makes it a strong choice for ISVs and enterprises with complex, proprietary reporting workflows.
Typical use cases: Custom KPI tracking in finance and healthcare, tailored client facing reporting portals.
Business Intelligence Tools Comparison at a Glance
| Tool | Best For | Deployment | Standout Strength |
| Microsoft Power BI | Microsoft centric enterprises | Cloud / on prem | Excel and Azure integration, Copilot AI |
| Looker Studio | Marketing and e-commerce | Cloud | Google/BigQuery integration, free tier |
| Domo | Data integration at scale | Cloud native | 1,000+ connectors, real time streaming |
| Qlik Sense | Complex data relationships | Multi cloud | Associative analytics engine |
| Tableau | Visualization and storytelling | Cloud / on prem | Best in class visual analytics, Tableau Pulse |
| Sisense | Embedded, custom analytics | Cloud / on prem | In chip processing, developer APIs |
| Zoho Analytics | SMBs on a budget | Cloud | Affordability, Zia AI assistant |
| SAP BusinessObjects | Large SAP enterprises | On prem/cloud | ERP integration, enterprise governance |
| TIBCO Spotfire | Advanced/predictive analytics | Cloud / on prem | Data science extensibility, real time streaming |
| Dundas BI | Highly tailored dashboards | On prem/cloud | Deep customization and scripting |
How to Choose the Right BI Tool for Your Enterprise?
No single platform wins on every dimension. A structured selection process prevents expensive mismatches:
1) Anchor to Outcomes First
Define the two or three decisions you most need to accelerate churn prevention, margin analysis, and supply chain visibility, and evaluate every tool against those specific use cases, not a generic feature checklist.
2) Audit Your Existing Data Landscape
If your warehouse is BigQuery, Looker Studio reduces integration friction immediately. If SAP is your system of record, BusinessObjects removes an ETL layer. Existing infrastructure often narrows the field faster than any feature comparison.
3) Match the Platform to Your Users
Analysts value SQL extensibility and Python integration. Frontline managers need drag and drop self service. Choosing a tool optimized for one group at the expense of the other creates adoption problems that no training budget fixes.
4) Pilot with Real Data, Real Questions
Run a 30 day proof of concept against your most complex reporting use case. Vendor demos use clean, pre built datasets. Your data will be messier, and the gaps will surface only in a live environment.
5) Calculate Total Cost of Ownership
Per user licensing is the starting point, not the finish line. Factor in infrastructure costs, connector licensing, training, and the internal engineering hours required to maintain the deployment.
If your organization is also evaluating adjacent data and automation platforms, the decision framework aligns closely with how enterprises select tools in automated data collection and intelligent process automation, capabilities that feed BI platforms with higher quality, higher frequency data.
Business Intelligence Trends Shaping 2026
1) AI Augmented Analytics
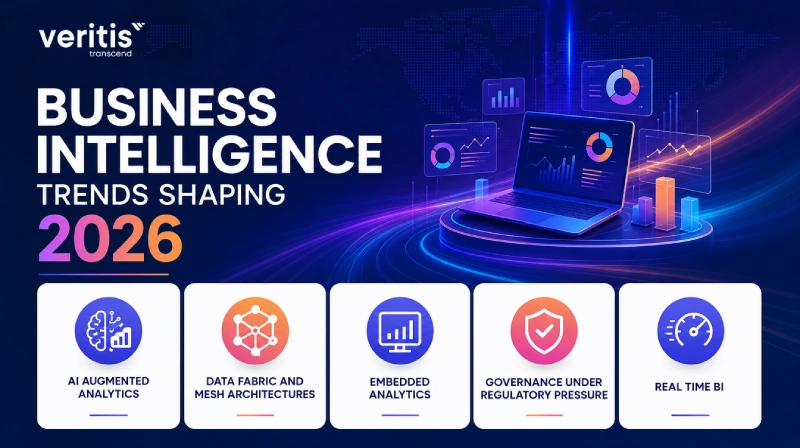
AI augmented analytics is the defining shift. Platforms that previously required a data analyst to build a report now surface recommendations, detect anomalies, and generate narrative summaries autonomously. The analyst role shifts from report builder to insight interpreter.
2) Data Fabric and Mesh Architectures
Data fabric and mesh architectures are replacing centralized warehouses in large enterprises. BI tools must now query distributed data products across domains without requiring centralized ETL, a capability that is separating the enterprise grade platforms from the rest of the market.
3) Embedded Analytics
Embedded analytics is accelerating. Product teams are embedding BI capabilities directly into operational applications so that users get insight in their workflow context rather than switching to a separate dashboard. Sisense and Dundas BI have a structural advantage here.
4) Governance Under Regulatory Pressure
Governance under regulatory pressure is intensifying. As data privacy regulations expand across US states and the EU tightens GDPR enforcement, BI platforms with immature access controls and audit capabilities are creating legal exposure. Governance is now a buying criterion, not an afterthought.
5) Real Time BI
Real time BI is becoming an expectation rather than a premium feature. Streaming data from IoT devices, transactional systems, and digital channels means that T+24 hour dashboards are losing relevance in industries where conditions change hourly.
These trends intersect directly with the broader enterprise AI and MLOps maturity curve. Organizations building out their MLOps capabilities will find that a mature BI layer is a prerequisite for operationalizing the outputs of machine learning models.
A Note on Implementation: Where BI Projects Succeed or Fail
Tool selection accounts for roughly 30% of a BI program’s success. The remaining 70% is execution, data quality, governance design, change management, and sustained stakeholder adoption.
Common failure patterns Veritis has observed across enterprise BI engagements:
- Launching without a data governance charter. Dashboards built on ungoverned data create confident decisions based on wrong numbers, a worse outcome than having no dashboard at all.
- Underinvesting in data engineering. A visualization layer on top of a messy data warehouse produces messy insights. The warehouse must be investment grade before the BI layer delivers value.
- Treating BI as an IT project. The most successful deployments are business led with IT support, not the reverse. Business stakeholders should drive KPI ownership, metric definitions, and access decisions.
- Skipping the change management layer. A platform that analysts love but executives never open has failed, regardless of its technical capabilities.
Useful link: Data Security in the Cloud Solutions Every Modern Business Needs
Strategic Conclusion
The gap between organizations that treat BI as a reporting utility and those that treat it as a strategic asset is widening. In 2026, the platforms covered in this guide give enterprise leaders the analytical infrastructure to make faster, better calibrated decisions, but only when the implementation is grounded in governance, data quality, and a clear link between dashboards and business outcomes.
Selecting a BI tool is a strategic decision, not a procurement transaction. The platform you pick will shape how your organization understands itself and responds to the market for the next three to five years. Invest the time to get the selection right, pilot with real data, and build the governance foundation before scaling adoption.
Veritis works with mid to large enterprises across the US to design, implement, and scale Business Intelligence environments that align with executive strategy, from warehouse architecture and data governance to dashboard development and user enablement. Our enterprise data management services provide the trusted data foundation required to maximize the value of every Business Intelligence investment. If your current BI environment is not delivering the clarity and speed your leadership team requires, that is the conversation worth having.
Ready to accelerate your BI strategy? Contact Veritis to discuss your data environment and define the right path forward.