DevOps, the word that needs no introduction in a software environment! Making its entry as a process to streamline software delivery, DevOps emerged as the whole and sole for most organizations.
Not just impacting the software delivery, DevOps best practices brought about an all around cultural transformation, filling the void among teams. DevOps automation tools include Ansible, Jenkins, Git, Kubernetes, Splunk, Docker, etc.
Implementing the DevOps methodology has demonstrated substantial success within IT organizations, with 99% of companies reporting significant growth. Although DevOps is a relatively recent approach, industry leaders such as IBM, Microsoft, and Atlassian have wholeheartedly adopted DevOps practices throughout their operations.
However, it’s important to note that DevOps is not a one size fits all solution that automatically guarantees improved and expedited deliverables. Instead, it necessitates diligent tracking of metrics to optimize operational DevOps processes and ensure the successful delivery of products.
In this context, measuring key performance indicators (KPIs) is crucial for assessing the return on investment (ROI). This is especially pertinent because DevOps professionals command high salaries, requiring assurance that their efforts genuinely enhance an organization’s development and operations.
As crucial to digital transformation, DevOps capabilities have also successfully driven the desired Return on Investment (ROI) and achieved 100% customer satisfaction for many businesses.
All these advantages with DevOps don’t come quickly, and the secret lies in understanding a few metrics and Key Performance Indicators (KPIs). CI/CD KPIs and SLAs are typically defined for this service, as for other company services, if a company runs CI/CD as a central service.
It’s crucial to carefully consider the metrics you need to monitor, and remember that no single solution works for all situations. The goal is to select metrics that provide the most relevant information for your company, preferably those that focus on specific business results.
Why DevOps Metrics Matter: Benchmarks that Define Success?
According to the 2025 State of DevOps Report, enterprises that prioritize DevOps metrics experience:
According to DORA (DevOps Research and Assessment) studies, elite DevOps teams consistently outperform their peers with measurable results:
- 127× faster deployment frequency
- 2,955× faster lead time for changes
- 7× lower change failure rates
- 2,604× faster service recovery times
More importantly, each metric ties directly to business outcomes:
- Faster deployments: Shorter time to market and competitive advantage.
- Lower failure rates: Lead to greater customer trust and reliability.
- Faster recovery times: Reduced downtime and minimized revenue loss.
Yet, simply adopting DevOps tools isn’t enough. Executives must align DevOps performance with broader business outcomes, including growth, agility, and resilience. This guide helps you identify and use the most impactful DevOps metrics to stay competitive and measurable in the digital age.
What Are DevOps Metrics and Why Do They Matter to Executives?
A DevOps metric is a data driven indicator or a small dataset employed to quantify, monitor, evaluate, and compare various aspects of a process, performance, or production within a DevOps context. These metrics provide insights into the efficiency, effectiveness, and reliability of your software development pipeline, enabling the prompt identification, isolation, and resolution of bottlenecks.
DevOps metrics encompass a broad spectrum, covering technical capabilities, team DevOps processes, and cultural aspects. They serve as valuable DevOps automation tools for gauging incremental changes, including improvements in software quality, accelerated release cycles, and enhanced application performance.
Below, we highlight some pivotal DevOps metrics and Key Performance Indicators (KPIs) that merit close tracking. It’s important to note that the specific choice of critical metrics to measure and act upon will vary depending on the unique DevOps challenges an organization seeks to address.
The benefits of DevOps ultimately lead to increased customer satisfaction. These include swifter, more efficient product delivery; expedited issue resolution; reduced complexity; enhanced scalability and availability; more stable operational environments; optimized resource utilization; greater automation; improved visibility into system outcomes; and a greater emphasis on innovation.
They are used not just by engineers but increasingly by CIOs, CTOs, and COOs to:
- Monitor deployment health
- Improve agility
- Ensure system stability
- Optimize customer experience
- Justify technology investments
The right metrics provide clarity, control, and confidence at every level of the organization.
Useful Link: DevOps outsourcing: Things to Know About Before Getting Started
What Types of DevOps Metrics Should Leaders Track?

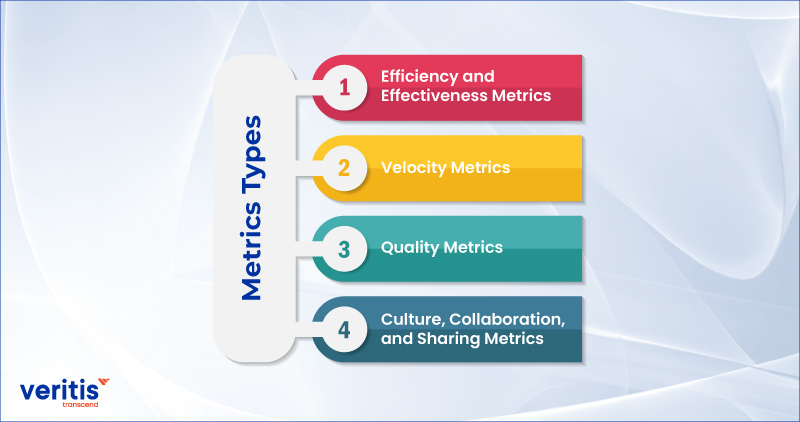
Key Performance Indicators (KPIs) are categorized into four primary groups within the realm of DevOps:
1) Efficiency and Effectiveness Metrics
Traditionally, these metrics encompassed conventional assessments of development capacity and operational capabilities, often including metrics such as server to admin ratios. Recently, there has been a shift towards incorporating more customer centric metrics, such as Full Time Equivalents (FTEs) per customer, to gauge how efficiently and effectively an organization serves its clientele.
2) Velocity Metrics
The acceleration of application delivery is a pivotal driver of successful DevOps practices. Tracking velocity metrics assesses the organization’s ability to improve application delivery by emphasizing IT’s responsiveness to improving business demands. These metrics highlight the extent to which the IT organization has embraced automation and eliminated manual or isolated tasks, ultimately reducing time to market significantly.
3) Quality Metrics
Puppet’s State of DevOps report highlights that the pressure to deploy faster and more frequently often leads lower performing IT teams to neglect the importance of building quality into their software. In contrast, high performing teams recognize that speed and stability are not mutually exclusive; instead, they understand that both are essential for success. They understand that quality is a shared responsibility throughout the software delivery DevOps life cycle and should be integrated into the development process from its early stages.
4) Culture, Collaboration, and Sharing Metrics
Effective communication, collaboration, and integration between development and operations are vital for DevOps. It’s not solely about having the right DevOps processes and technology but also about evaluating the human element within the organization. Metrics focused on culture, collaboration, and sharing provide insights into the acceptance or resistance to DevOps practices. This shift in approach is pivotal for adopting agile methodologies, continuous delivery, and deployment, and it necessitates the early involvement of Operations in the software DevOps life cycle and a heightened focus on application support within Development.
Useful Link: Derive ‘ROI’ from ‘DevOps’: An Overview of Performance and Metrics
Which DevOps Metrics Are Essential for Success in 2025?
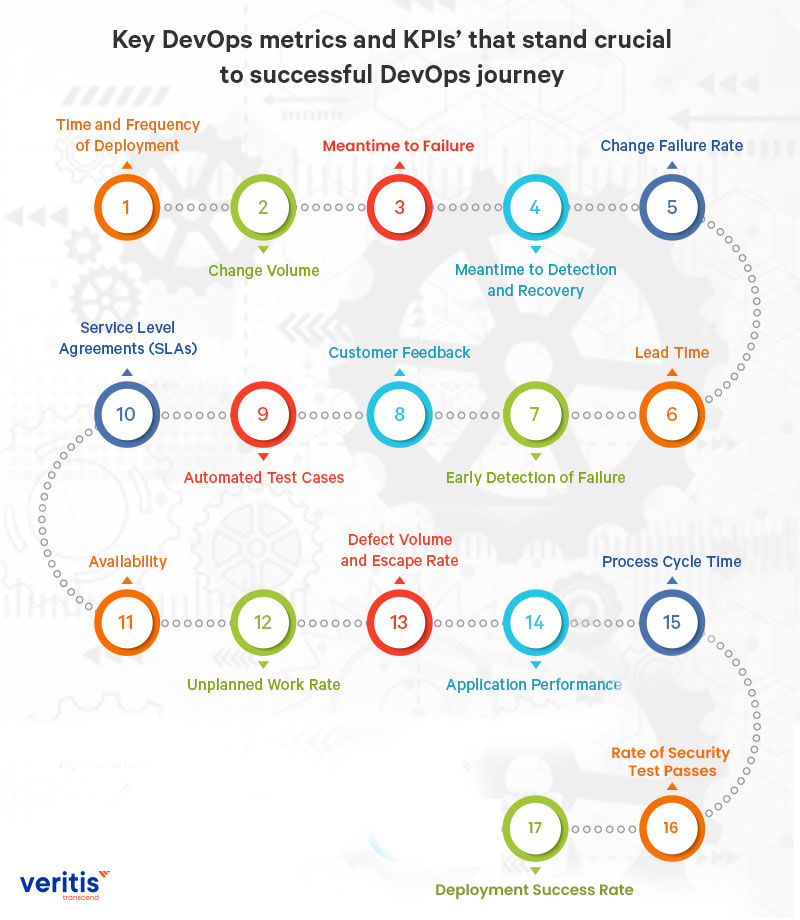
Key DevOps Metrics and KPI’s that are crucial to a successful DevOps lifecycle journey:

1) Time and Frequency of Deployment
The old concept involved a single, bulky deployment for extended periods. In the DevOps transformation steps, more deployments result in more releases and improve your business interaction with the end user. Tracking deployment frequency helps you stay on track and plan smaller deployments that improve test and release cycles.
This will also reduce deployment time, often resulting in much investigation time.
2) Change Volume
Code is the deciding factor here. Change Volume is the number of lines of code you push to production per deployment. Measuring this is crucial to measuring the success of deployment in terms of value, time, and frequency.
3) Meantime To Failure
This is also referred to as the failed deployment rate and is also related to changes in the volume. Increasing the mean time to failure and the low change volume cause process dysfunction, leading to workflow delays.
4) Meantime to Detection and Recovery
Mean Time to Recovery (MTTR) is the time required to recover from a failed instance. This defines your organizational ability to face and address failures. This is one of the most popular DevOps automation metrics. Meanwhile, Mean Time to Detection (MTTD) refers to the time it takes to identify an issue, which requires application monitoring to detect it early.
5) Change Failure Rate
Change failure rate explains the extent of release failure caused by unexpected outages or other failures. A low failure rate means faster, more timely deployments. At the same time, the high side indicates poor application performance, which negatively impacts end user satisfaction.
6) Lead Time
This is crucial if the end goal is ‘faster shipping.’ This is measured as the time it takes for the change process to transition from the start to the deployment phase. This helps you estimate the time required to bring a specific task into production.
7) Early Detection of Failure
This is as important as executing the process. Any unexpected failure may stall the process. Early detection of failure helps you find appropriate solutions without delay and recover more quickly to get back on track. It also helps you assess if the implemented response measures are enough.
8) Customer Feedback
More product feedback or alerts from your customer support team means more gaps in your business at the customer end. The worst thing a business can expect is terrible feedback from its end users. Given this factor, customer feedback (positive or negative) is one of the most reliable metrics for DevOps services.
Useful Link: Top 10 DevOps Skills Every Aspiring DevOps Engineer Needs in 2025
9) Automated Test Cases
Automated test cases should be utilized to the maximum to achieve better performance results within the DevOps adoption strategy. The extensive use of unit and functional testing naturally boosts workflow velocity. Keep a close watch on code changes and their impact on test cases. Ensure automated tests run perfectly!
10) Service Level Agreements (SLAs)
Comply with your SLAs. Any disagreement with SLAs can cause issues later on, hindering the workflow. It’s essential to operate in line with your SLAs. In the absence of SLAs, meet the set application requirements.
11) Availability
This refers to the presence of service during the downtime. It is usually provided in two ways: partial (read only) and complete (read and write). Less downtime results in more availability. However, 100 percent availability is unrealistic, as planned downtime would be required for scheduled maintenance.
12) Unplanned Work Rate
This is another crucial DevOps metric that reflects the effective utilization of resources. This calculates and tracks the time spent on unplanned work relative to planned work. The unplanned work rate is often compared with the rework rate, which reflects the effort required to address feedback.
13) Defect Volume and Escape Rate
This rate examines how often the defects are identified and uncovered in the pre production phase compared to the production phase. The defect escape rate reflects the core principle that defects are a natural part of a software development cycle and should be identified early.
14) Application Performance
The best practice is to check the application’s performance before deployment. There are specific DevOps automation tools that can help you trace performance issues, hidden errors, and gaps within an application. This monitoring of application performance must continue even after the application is deployed.
15) Process Cycle Time
This KPI measures the total time taken from the ideation stage to the end with user feedback. This metric presents a broader view of application deployment. Shorter DevOps life cycles are highly recommended, but not at the cost of defects.
16) Rate of Security Test Passes
This DevOps Key Performance Indicator (KPI) focuses on adopting secure practices and evaluating the feasibility of an integration test.
Identifying several unsuccessful security tests during the build phase is a critical indicator of potential flaws, effectively averting the deployment of faulty releases into the production or live environment. To enhance your team’s proficiency in this regard, obtaining a DevOps Fundamentals Certification can be a highly beneficial strategy.
17) Deployment Success Rate
The metric in focus here is the “Deployment Success Rate,” a crucial parameter often overlooked as engineering managers and CTOs strive to accelerate deployment speed and frequency. In this pursuit, some may unintentionally forsake established best practices, leading to repercussions such as deployment failures and software defects. This is where partnering with a reliable DevOps services company can provide valuable expertise to maintain a balance between speed and quality.
To avoid such pitfalls, managers must meticulously monitor the Deployment Success Rate, which involves assessing the ratio of successful deployments to failed deployments.
However, the initial step in this process is to formulate precise criteria for defining success. For instance, the successful execution of a rollback procedure might be considered a success, even if it means the primary deployment was not completed as intended. Conversely, a deployment could be considered unsuccessful if a variable, such as the presence of a rollback procedure, impedes its progress. Establishing these criteria is pivotal for an accurate evaluation of deployment success.
Useful Links: How C-Suite Executives Look at DevOps?
How Can You Implement DevOps KPIs Effectively?
While we have seen a list of critical metrics and DevOps KPIs, it’s equally important to understand how they evolve throughout the DevOps lifecycle.

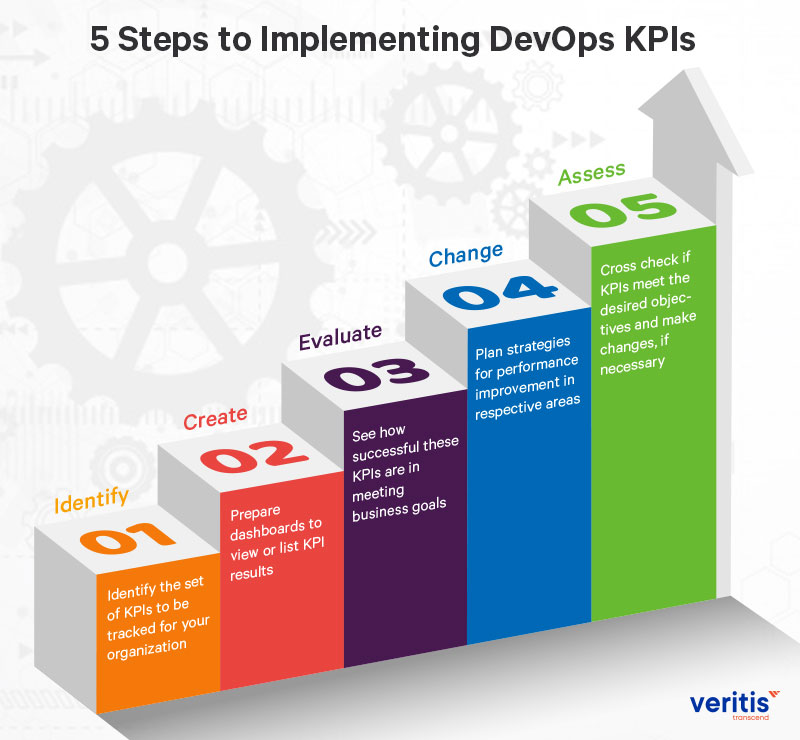
The implementation of DevOps KPIs is built on five steps:
1) Identify
Identify the set of KPIs to be tracked for your organization
2) Create
Prepare dashboards to view or list KPI results
3) Evaluate
See how successful these KPIs are in meeting business goals
4) Change
Plan strategies for performance improvement in respective areas
5) Assess
Cross check if KPIs meet the desired objectives and make changes, if necessary
These five steps help you effectively implement the identified DevOps KPIs and metrics to drive your DevOps success.
MUST READ: DevOps Frequently Asked Questions
2025 DevOps Stats C-Suite Leaders Should Know:
- 70% of DevOps failures are due to cultural and KPI misalignment (McKinsey)
- Companies that adopt DevOps and AI together see a 45% boost in delivery speed (Gartner)
- DevOps ROI is highest when tied to business KPIs like NPS, churn rate, and operational cost reduction
Tools and Techniques to Measure DevOps Metrics
Organizations use a mix of monitoring, automation, and CI/CD platforms to track DevOps performance effectively:
- Monitoring & Observability: Prometheus, Grafana, Datadog, New Relic, ELK Stack, Splunk.
- CI/CD Pipelines: Jenkins, GitLab CI/CD, GitHub Actions.
- Incident Response: PagerDuty, Opsgenie, ServiceNow.
Roadmap: How to Establish a DevOps Metrics Program
1) Align Metrics with Business Goals: By prioritizing metrics that directly link to delivery speed, reliability, and customer value, such as reducing lead time, improving change failure rate, and enhancing customer satisfaction.
2) Set Realistic Targets: By aiming for achievable goals like a < 1 day lead time and a <5% change failure rate, you can keep your team focused and motivated, ensuring steady progress and success.
3) Use Historical Data: Benchmarking your current performance before setting improvement goals provides a solid foundation for your decisions, instilling confidence in your strategy.
4) Automate Data Collection: Integrate observability tools and CI/CD pipelines to capture metrics continuously and consistently.
5) Review & Refine Regularly: Metrics should evolve in line with business needs and technological maturity.
Real World Case Study: Measuring DevOps Success in Action
To better understand the impact of DevOps metrics and KPIs, consider a real world example from the electronics industry. Veritis partnered with a client to implement a DevOps driven approach for enhancing IT infrastructure and facilitating seamless migration from virtual machines (VMs) to the cloud. By applying key DevOps metrics, such as deployment frequency, change lead time, and system uptime, the organization achieved improved operational efficiency, faster delivery cycles, and reduced downtime.
This case exemplifies how tracking the right KPIs can directly impact business outcomes and drive successful digital transformation.
To explore the full success story, read the case study: Implementing DevOps for IT Infra and VM to Cloud Migration in Electronics Industry
Conclusion
Many such KPIs and metrics contribute to DevOps success. Wait no more! Utilize these metrics and effectively implement them to achieve the following levels of your DevOps lifecycle journey. Veritis, the Stevie Award, and Globee Business Award winner, offers DevOps consulting services to clients with services encompassing multiple capabilities, including iterative and incremental development, on demand workload management, lightweight architecture, DevOps security, and automated testing methodologies.