
Here is an exciting update about DevOps!
The annual Accelerate State of DevOps Report is back with interesting updates on changing IT trends and technology transformations.
Here are some key excerpts from the Accelerate State of DevOps 2019 report:
Executive Summary
The Accelerate State of DevOps 2019 report covered a wide range of matters, emphasizing on:
Organizations’ inclination towards engineering productivity initiatives:
- Supportive information search
- More usable deployment toolchains
- Reducing technical debt through a flexible architecture
- Code maintainability
- Viewable systems
Identifying capabilities to drive improvement in four key metrics:
- Technical practices
- Cloud adoption
- Organizational practices
- Culture
Guidance for organizations seeking support on ways to improve:
- Start with foundations
- Adopt a continuous improvement mindset by identifying your unique constraint
- Effective strategies for enacting changes
Key Findings
The report covered opinions of 1000 IT professionals from different industries.
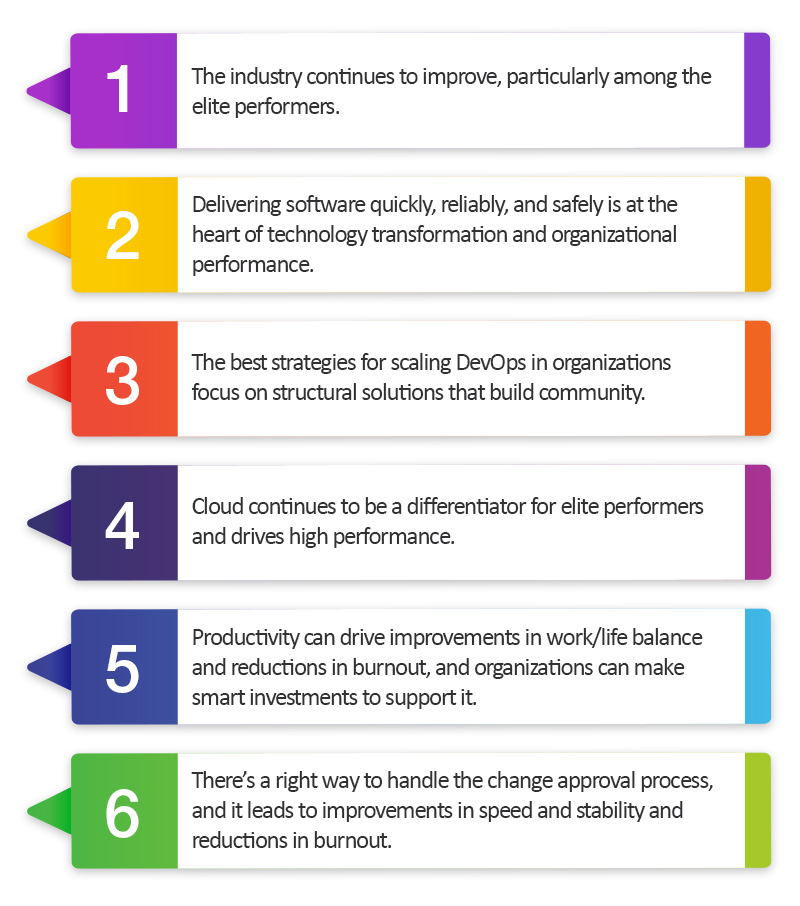
6 key findings from the report:
Other Important Findings
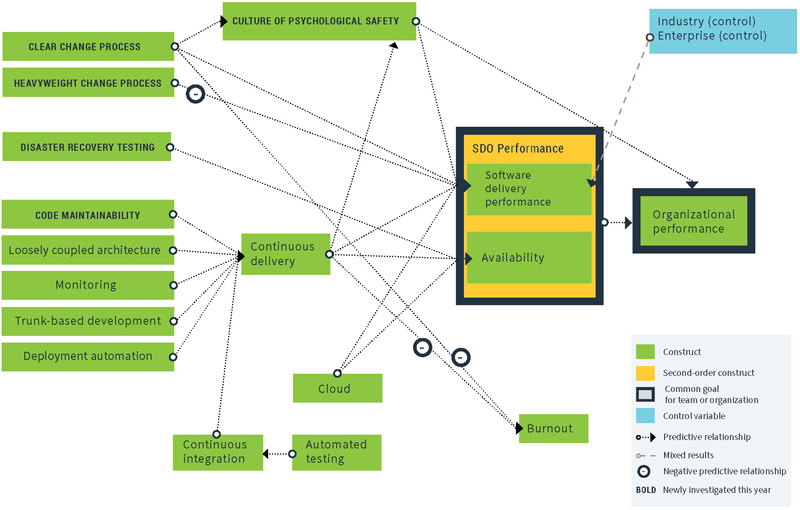
1) Cloud Adoption
Respondents report increasing usage of multi-cloud or hybrid cloud services compared to the previous year, mainly because these services offer high flexibility, control, availability, and performance gains. Eighty percent of respondents had their primary applications or services hosted on a cloud platform.
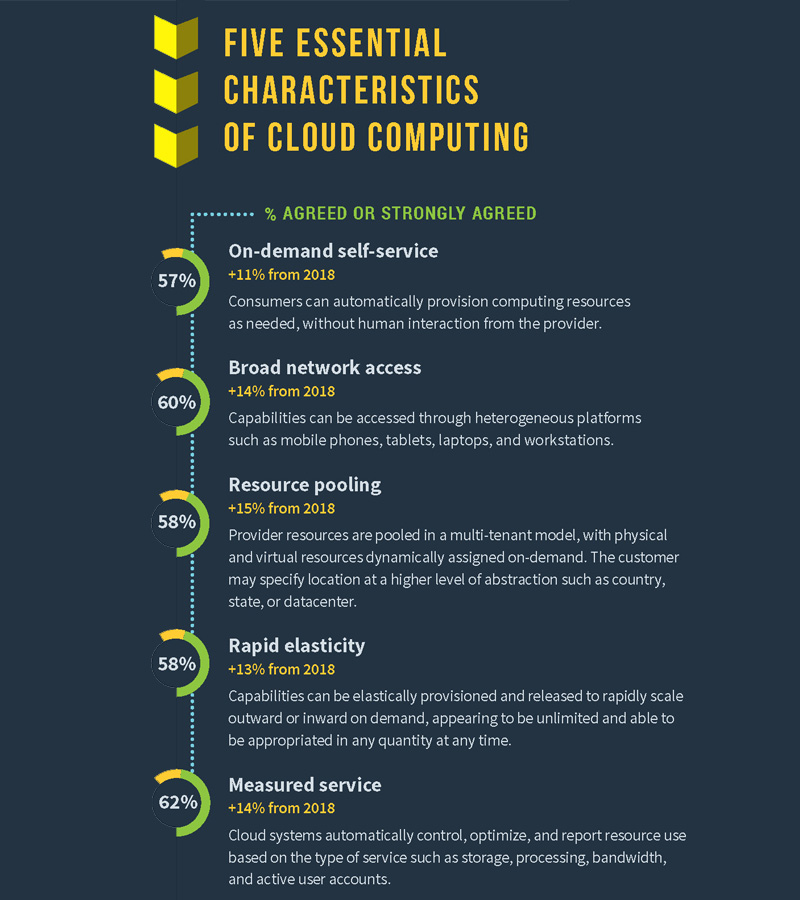
On-demand scaling is one of the primary reasons for increasing cloud adoption.
Teams that take advantage of dynamic scaling can make the infrastructure behind their service elastically react to user demand. Teams can monitor their services and automatically scale their infrastructure as needed.
According to the survey, cloud abstractions have changed how infrastructure is visualized.
Typical Platform-As-Service (PaaS) offerings are also found to be more inclined toward a containerization-driven deployment model, with container images as the packaging method and container runtimes for execution.
Adopting cloud best practices is a path to gaining better visibility into the costs of running technologies.
Respondents who met all essential cloud characteristics reported:
- 2.6 times more accuracy in estimating operational software costs
- Twice as likely to be able to identify their most operationally expensive applications easily
- 1.65 times as likely to stay under their software operation budget
2) Software Delivery and Operational Performance
The report mentions five key metrics that provide a holistic view of software delivery and performance.
While the first four metrics measure effectiveness in development and delivery processes, the last focuses on operational capabilities.
These five metrics, together called Software Delivery and Operational (SDO) performance, aim at achieving system-level outcomes. They help organizations avoid common pitfalls of software metrics and achieve desired goals.
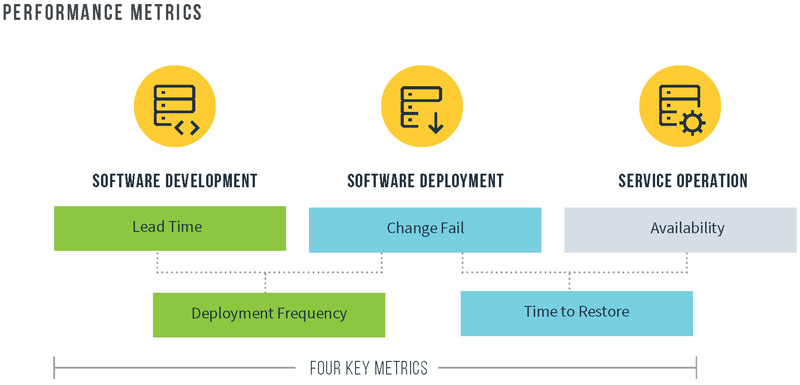
The report further explains that ‘availability measures’ significantly correlate with software delivery performance.
Elite and high performers consistently reported superior availability, with elite performers being 1.7 times more likely to have strong availability practices
3) Industry and Organizational Impacts
Enterprise organizations with more than 5,000 employees were found to perform less well than those with fewer than 5,000 employees.
These gaps in large enterprises are largely attributed to factors such as heavyweight processes and controls and tightly coupled architectures that cause delay and associated instability.
Many analysts are report the industry has “crossed the chasm” with regards to DevOps and technology transformation, and our analysis this year confirms these observations.
The report says that the industry velocity is increasing, offering additional scope for speed and stability, and the growing adoption of cloud technology is witnessing this acceleration.
4) Deployment Frequency
Elite performers can maintain dominance due to deployment frequency compared to low performers.
Per the findings, the elite performers have been consistently deploying on-demand and performing multiple daily deployments.
Whereas low performers were found performing deployments only once per month or twice a year.
At the normalized rate, the elite organizations made at least 1,460 deployments per year (at the rate of 4 per day x 365 days), while low performers did only 7 per year (at an average of 12 per month and 2 per year).
Whereas, top-performing companies like Amazon, Google and Netflix deploy a thousand times a day.
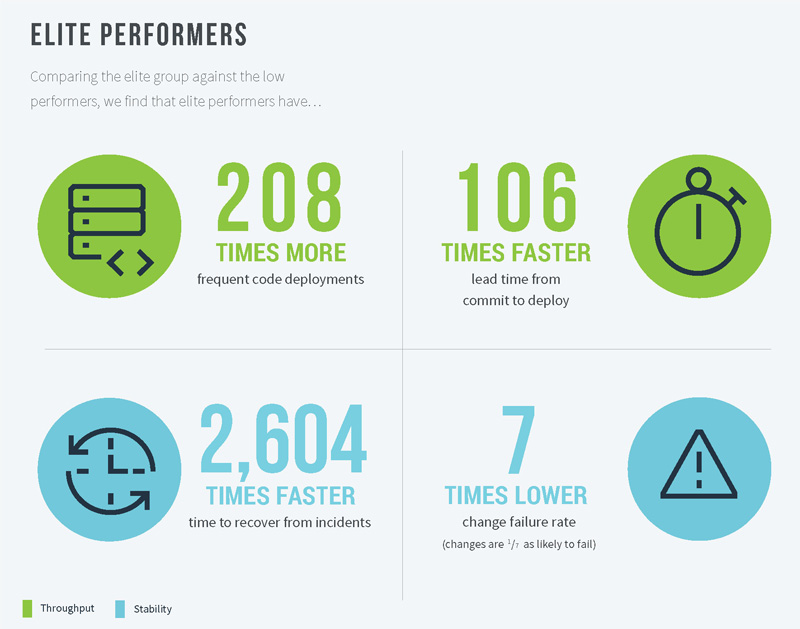
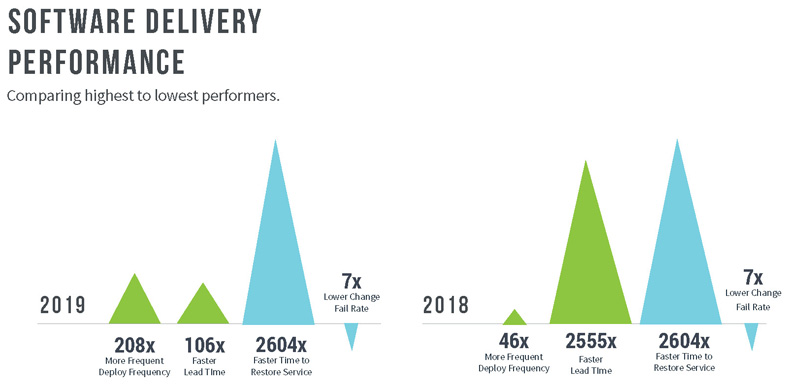
Extending this analysis shows that elite performers deploy code 208 times more frequently than low performers.
5) Change Lead Time
Elite performers report ‘less than a day’ change lead time, the time from code committed to successfully deploying the same into production.
On the other hand, low performers reported lead times between 1 and 6 months.
At this rate of 24 hours (elite performers) and 2,555 hours (low performers), the elite group shows 106 times faster change lead times than the low-performing group.
6) Time to Restore
Elite performers performed ‘less than one hour’ to restore services in case of an unexpected event, while it took one week to one month for low performers.
Calculating the rate of ‘time to restore services’ by conservative time ranges (one hour for high performers and the mean of one week (168 hours) and one month (5,040 hours) for low performers), elites show 2,604 times faster time to restore service compared to low performers.
However, the time to restore service performance stayed the same for both elite and low performers compared to the previous year.
7) Change Failure Rate
The ‘change failure rate’ for elite performers lies between 0-15%, while it is 46-60% among low performers.
Calculating the meantime between these two ranges, the change failure rate for elite performers was 7.5%, while 53% was for low performers.
Thus, elite performers show 7 times better than low performers in terms of change failure rate.
8) Continuous Integration and Continuous Delivery
The survey says the team and organizational efforts should be concurrent enough to reach desired objectives.
While the end goal is to enhance software delivery through technical practices like Continuous Integration (CI) and Continuous Delivery, that can’t happen to give success without a strong motive.
Instead, it should focus on organizational goals such as profitability, productivity, and customer satisfaction.
Continuous delivery must be done with an eye to organizational goals such as profitability, productivity, and customer satisfaction.
Moreover, the survey reports that automated testing has a significant positive impact on the CI process.
In previous years, we tested the importance of automated testing and CI but didn’t look at the relationship between the two. This year, we found that automated testing drives improvements in CI. It means smart investments in building automated test suites will help improve CI.
The report also mentioned the loosely coupled architecture and its positive impact on CD, adding that this would, however, require orchestration at a higher level.
9) Disaster Recovery Testing
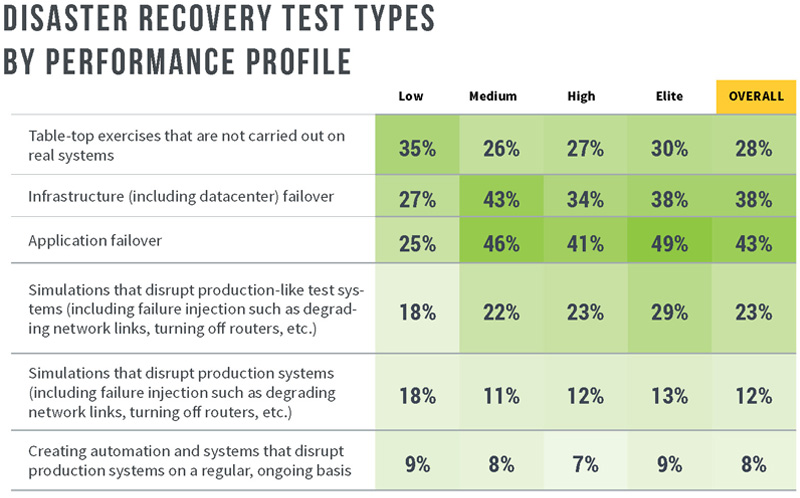
When surveyed about performing ‘Disaster Recovery Tests’ on production infrastructure, 40% of respondents said they are doing so on:
- Simulations that disrupt production systems (including failure injection such as degrading network links, turning off routers, etc.)
- Infrastructure (including data center) failover
- Application failover
Organizations that did so as a regular practice enjoyed higher service availability.
Moreover, these exercises among organizations working cross-functionally and cross-organizationally have reportedly strengthened the processes and communication surrounding the tested systems, making them more efficient and effective.
10) Culture of Psychological Safety
Culture is often considered the key to achieving success in DevOps and Digital transformation initiatives.
The report states that “culture that optimizes for information flow, trust, innovation and risk-sharing is predictive of SDO performance”.
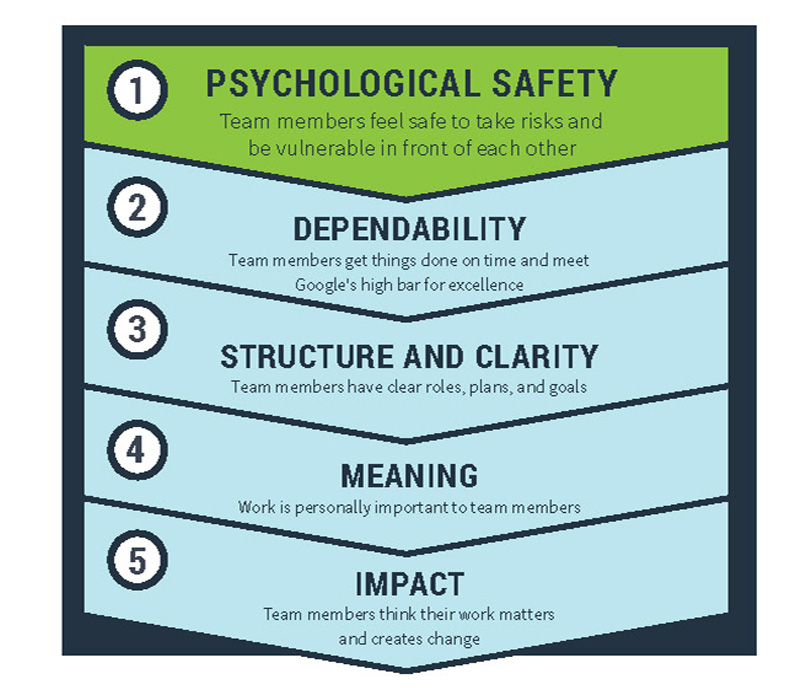
Internal research at Google found that a culture of trust and psychological safety, meaningful work, and clarity is the need of the hour for high-performing teams.
The report concludes that our analysis found that this culture of psychological safety is predictive of software delivery performance, organizational performance, and productivity.
11) Improving Productivity
Overall, the end goal is to improving productivity.
This is to be achieved by locating the goal first and then identify the capabilities that make a move.
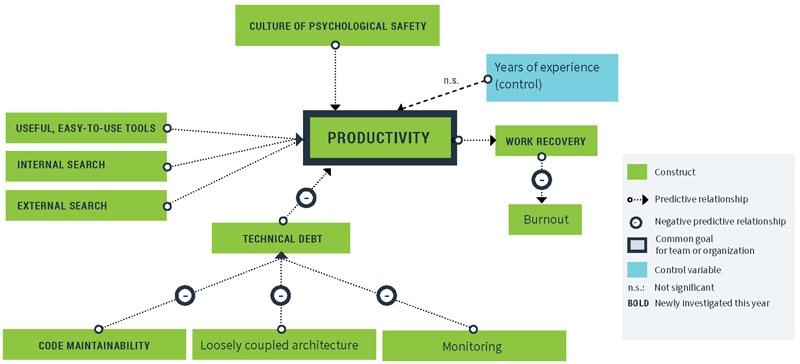
Improved productivity has a positive impact on:
- Work Recovery the ability to cope with work stress and detach from work when ‘away from work’
- Burnout a condition that results from unmanaged chronic workplace stress
Overall, the report defines Productivity as:
Ability to get complex, time-consuming tasks completed with minimal distractions and interruptions.
On an EndNote
After verifying key capabilities and strategies that enhance software delivery for six consecutive years, the State of DevOps Report 2019 concludes that the continued evidence shows ‘DevOps has delivered significant value’.
DevOps is not a trend and will eventually be the standard way of software development and operations, offering everyone a better quality of life, it concluded.
Related Blog Posts:
- DevOps Compliance – Win Regulatory with DevOps Automation
- List of DevOps Tools for Automation
- 2019 Accelerate State of DevOps Report
- #10 Priorities Around Container Adoption in DevOps Lifecycle
- How DevOps can help Logistics Industry?
- DevOps for Retail Industry
- What to Measure in a DevOps Maturity Model?
- What is Cloud Maturity Model (CMM)?
- Derive ‘ROI’ from ‘DevOps’: An Overview of Performance and Metrics